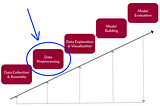
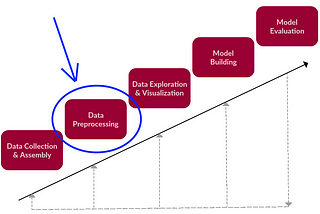
PinnedKaran PatelinPython in Plain EnglishIntroduction To Data Science: Data Preprocessing In PythonLearn about different data preprocessing techniques using the Sklearn library.6 min read·Aug 26, 2021--2--2
Karan PatelAnalyzing Breast Cancer DataPerform visual programming using Orange3 and visualize the data in Power BI4 min read·Nov 16, 2021----
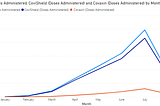
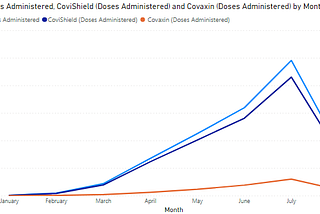
Karan PatelVisualising COVID-19 Data Using Power BICreating reports and dashboards of vaccination details and number of cases reported4 min read·Oct 29, 2021----
Karan PatelinPython in Plain EnglishHow to Predict the Gender and Age Using OpenCV in PythonData Science Series: Predicting gender and age range of an individual using OpenCV in Python.3 min read·Oct 28, 2021--1--1
Karan PatelData Science Series | Generating dashboards using Power BIStep to step guide to creating dashboards in Power BI2 min read·Oct 27, 2021----
Karan PatelData Science Series | Creating reports using Power BILearn how to use different types of charts to create reports in Power BI3 min read·Oct 27, 2021----
Karan PatelinGeek CultureGetting started with PowerBI — Modeling the dataLearn how to analyze and create models of data using Power BI3 min read·Oct 27, 2021----
Karan PatelinPython in Plain EnglishIntroduction To Data Science: Data Reduction Techniques In PythonLearn about how to apply different data reduction techniques using the Sklearn library.6 min read·Oct 27, 2021----
Karan PatelinGeek CultureData Science Series | Introduction To Neo4j and Gephi ToolA Beginner’s guide on how to use Neo4j and Gephi data visualization tools.3 min read·Oct 16, 2021----
Karan PatelinPython in Plain EnglishData Science Series | Data Preprocessing Using Orange3A guide to data preprocessing using Orange and how to use Python in Orange.4 min read·Sep 22, 2021----